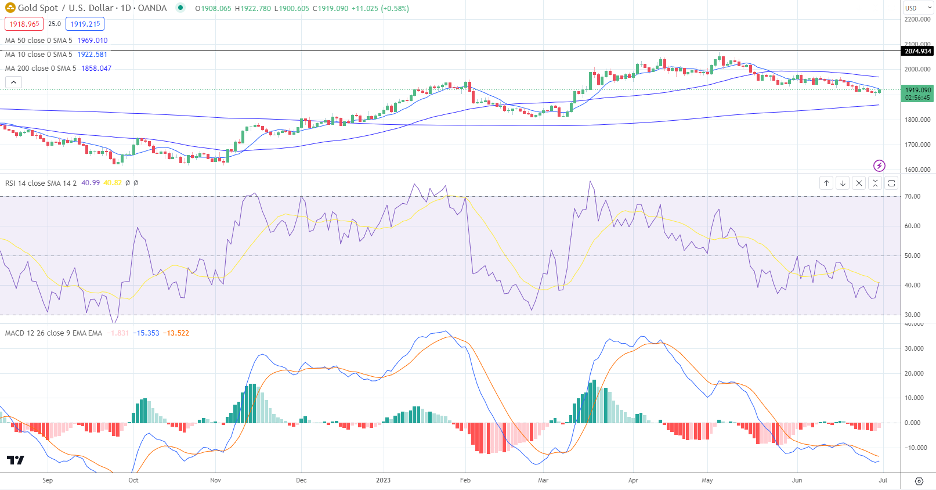
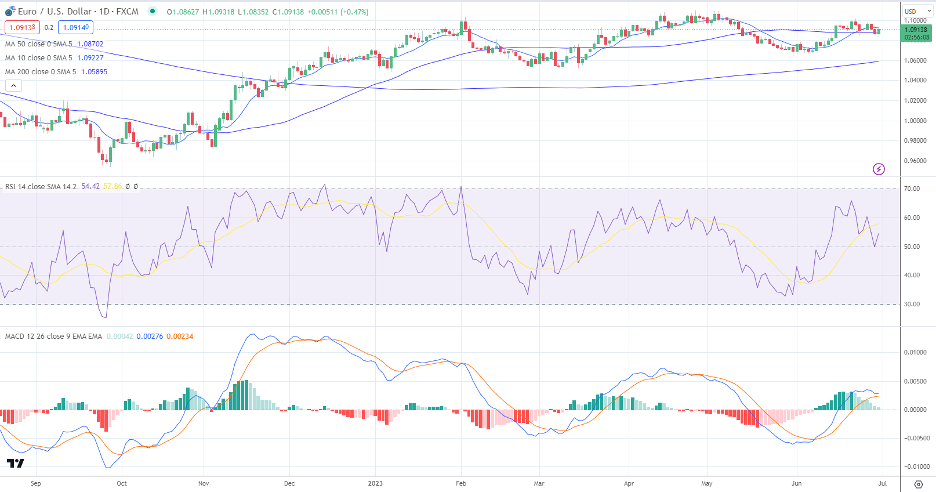
Gold prices have recovered from three-month lows after testing $1,800 per ounce in early March 2023. (see chart). Much of the recovery was due to a rally in the EUR/USD (see chart) as the dollar moved lower, allowing gold prices to gain traction. Since gold is quoted in U.S. dollars, a rally in the dollar makes gold more expensive in other countries. What generally occurs is that gold prices will adjust lower when the dollar rises to keep gold in dollar terms stable. While gold prices have recovered, there does not seem to be any upward momentum.
The technical pictures show that gold prices might continue to move sideways. The underlying theme that might drive the dollar higher or lower versus the Euro and other major currencies is whether the Federal Reserve is finished with its rate hike campaign or has more work. Another question is whether the ECB and the Bank of England will continue to be as or more aggressive in their fight against inflation than the Federal Reserve.
How Do Interest Rates Impact Gold Prices
Currency moves and interest rates impact gold. Since gold is quoted in dollars, the greenback movement is essential to the actions of gold prices. Gold will also usually decrease when interest rates rise and fall when interest rates rise.
Interest rates are also drivers of currency movements, which will alter the direction of gold prices. Interest rates change currencies through the differential between one currency’s interest rates and another. When the difference between two interest rates starts to move, purchasing one currency over another will make it more expensive.
For example, the U.S. Fed Fund’s overnight rate has increased from zero to 5.25% during the past eighteen months. The Japanese overnight rate has bearly moved and remains in negative territory. During the past 18 months, the dollar has become more attractive to hold relative to the Yen because the holder earns 5.25%, and the holder of the Yen needs to pay away interest. The differential of more than 5% means that if you hold USD/JPY, you earn about 5% per year. As the yield differential moves in favor of a country, the currency of that country will increase in value.
During 2022, when the Fed was tightening rates, and most other central banks were on hold, the dollar rallied, putting downward pressure on gold. In early 2023, the ECB and the BOE started to raise interest rates which stopped the upward Momentum of the dollar and allowed gold to gain traction through early 2023. When the Fed said they were not complete with its tightening cycle, the dollar rallied, and gold hit a low in February.
What is the Fed Likely to Do?
At a recent summit of central bankers, Fed Chair Jerome Powell said that the Fed is likely to keep rates higher for longer and that the Fed was not finished with its rate cycle. He said that while inflation has come down, it’s still well above the Fed target of 2%. The Fed’s favored inflation gauge has moved lower but remains well above the target. According to the U.S. Commerce Department, core personal consumption expenditures increased by 4.6% yearly, less than expected. Unfortunately, 4.6% is still well above the Fed’s 2% target.
Technical Analysis
Another way to look at gold prices is through the historical movements of gold trading. The technical analysis evaluates gold by analyzing the statistical trends gathered from trading activity, such as price movement and volume. Technical analysts believe that the historical performance of a security or market can be used to predict its future performance. Technical analysis uses charting tools and indicators to help identify trends and patterns in the price of a security.
Gold prices have eased but are still well off the lows seen in early March 2023 (see chart). Despite breaking out in early May, gold prices have been unable to gain traction, and Momentum has declined. Gold prices face several headwinds. The 10-day moving average and the 50-day moving average are seen as resistance to upward price movements (see chart). The next level of support for gold is near the 200-day moving average at $1,858 per ounce (see chart). One of the issues is the Momentum is negative but decelerating. You can measure Momentum by using the moving average convergence divergence) index.
What is the MACD
The Moving Average Convergence Divergence (MACD) is a technical indicator used in the analysis of financial markets. It is a momentum indicator that shows the relationship between two moving averages of prices. The MACD is calculated by subtracting the 26-day exponential moving average (EMA) from the 12-day EMA. The MACD line is then plotted against a signal line, a 9-day EMA of the MACD line. Traders use the MACD to identify potential buy and sell signals. A buy signal is generated when the MACD line crosses above the signal line, while a sell signal is generated when the MACD line crosses below the signal line.
The MACD (moving average convergence divergence) index is printing in negative territory, but the trajectory is pointing upward, reflecting a consolidation period.
What Does the RSI Say
Another momentum oscillator shows that prices are starting to turn up, but they are neither overbought nor oversold, and they are consolidating, reflecting no momentum.
One of the best momentum oscillators is the RSI. The Relative Strength Index (RSI) is a technical indicator used in the analysis of financial markets. It is intended to chart a stock or market’s current and historical strength or weakness based on the closing prices of a recent trading period. The RSI is classified as an oscillator, measuring the velocity and magnitude of directional price movements.
The Bottom Line
The upshot is that gold prices have rebounded from their three-month lows. Unfortunately, the trend has petered out, and Momentum has slowed. The MACD (moving average convergence divergence) index, a momentum indicator, shows that gold prices are consolidating. The same can be said for the relative strength index.
One of the components that drive the price of gold is the dollar. Since gold is quoted in U.S. Dollars, the change in the dollar influences the price of gold in other countries. For example, when the dollar rises relative to the Yen, gold becomes more expensive in Yen, even if gold in dollars remains the same. To accommodate this change, the value of gold usually adjusts lower when the dollar moves higher and adjusts higher when the dollar moves lower. The factor that will drive the move in the dollar is interest rate differentials. This concept is the difference between interest rates in one country relative to another.
For gold prices to gain ground, it will need the dollar to start moving lower. For the dollar to move lower, the market needs to be convinced that central banks worldwide will begin to increase rates while the Federal Reserve is holding steady or that the Federal Reserve will start lower rates.